Sample rate and bit depth explained
Sample rate sets the bandwidth a recording can hold; bit depth sets its noise floor. What Nyquist guarantees, why the staircase drawing is wrong, and the dynamic-range arithmetic derived in full.
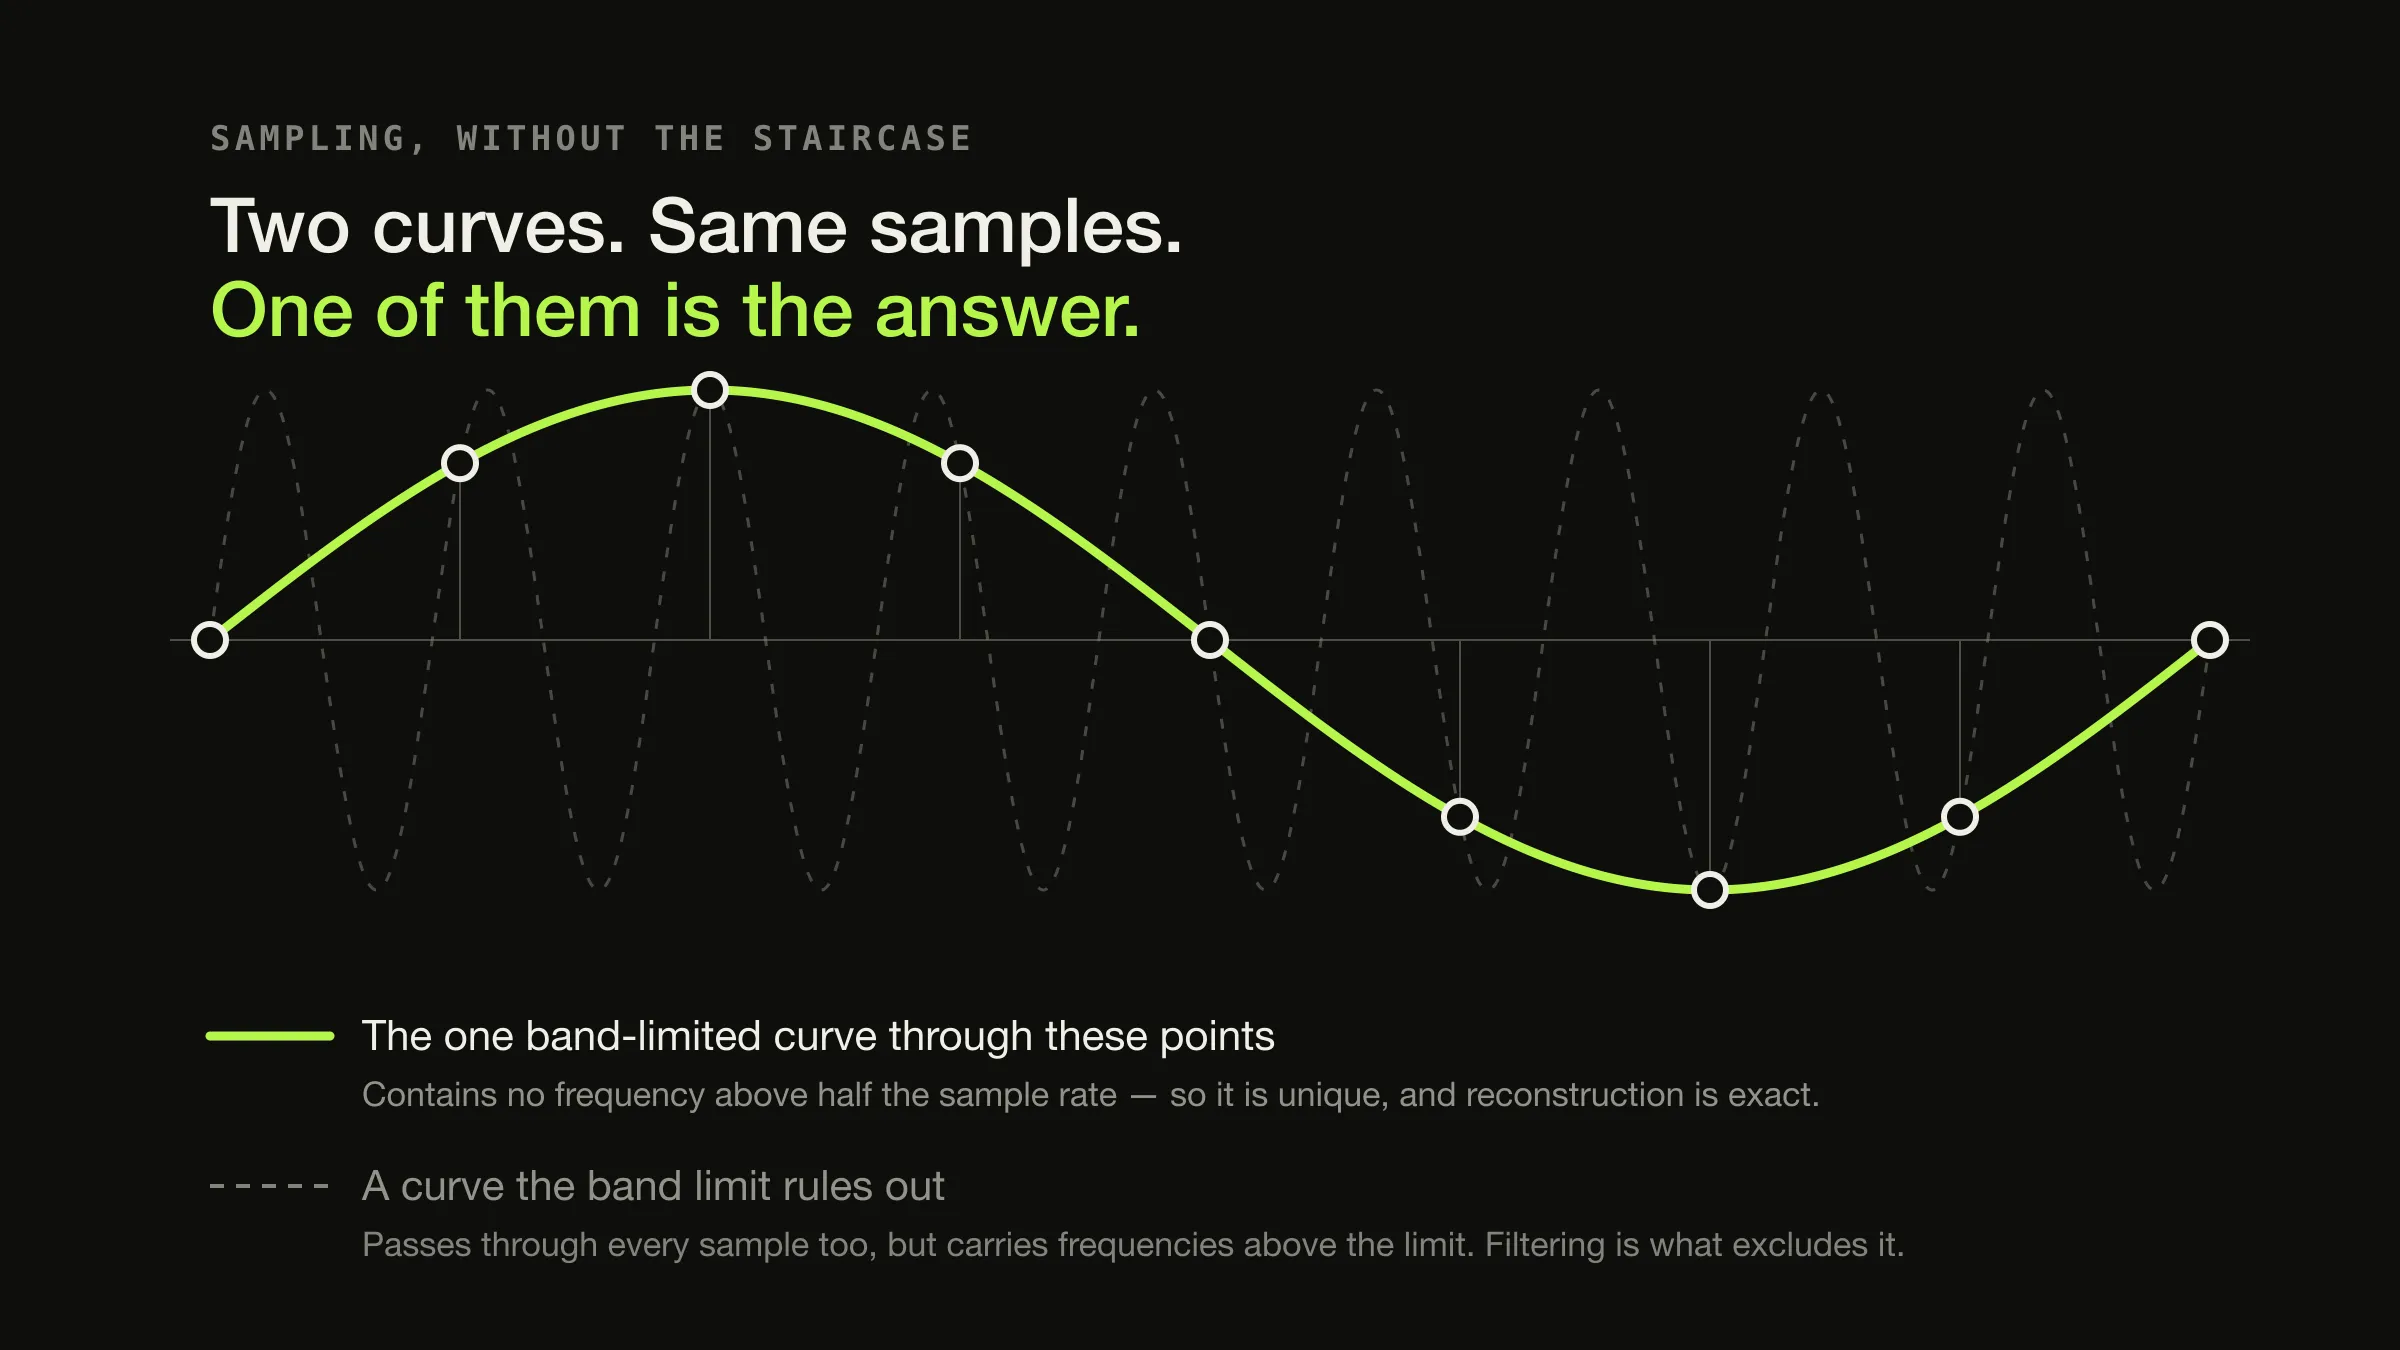
Sample rate is how many times per second the signal is measured, and it determines the bandwidth the recording can hold — nothing above half the sample rate. Bit depth is how finely each of those measurements is quantised, and it determines the noise floor, and therefore the dynamic range. They are two independent decisions about two different things.
Almost every popular explanation of this subject describes both of them as “resolution”, which is where the trouble starts. Resolution suggests that more of it produces a more detailed picture, as with pixels. Neither number works that way, and one of them — bit depth — works almost the opposite way: it does not add detail on top, it lowers the floor underneath.
Two consequences worth having in advance. A higher sample rate does not make the waveform smoother; the waveform was never rough. A higher bit depth does not add detail to the music; it moves the noise further away from it.
What the sampling theorem actually guarantees
The result everything else rests on is the Nyquist–Shannon sampling theorem, and it is usually paraphrased into something weaker than it is. Shannon’s own statement, in Communication in the Presence of Noise (1949), is Theorem 1:
If a function f(t) contains no frequencies higher than W cycles per second, it is completely determined by giving its ordinates at a series of points spaced 1/2W seconds apart.
Note the words completely determined. Not approximated, not adequately captured — determined. Given the band limit, the samples and the original signal carry exactly the same information, and one can be recovered from the other.
Two conditions are doing real work in that sentence, and both are easy to skip past.
The signal must be band-limited. Anything above half the sample rate has to be removed before sampling, which is what an anti-alias filter is for. Skip that and content above the limit does not disappear; it reappears as a lower frequency that was never in the music. That is aliasing, and it is a defect of the conversion rather than a property of sampling.
Reconstruction is a filter, not a join-the-dots exercise. The samples are turned back into a continuous signal by removing everything above half the sample rate again. This is the step the staircase drawing omits, and omitting it is what makes the drawing so misleading.
Why the staircase picture is wrong
The familiar illustration shows a smooth curve with a blocky red staircase over it, implying that digital audio is a crude approximation that gets less crude as the rate rises. Xiph.Org’s Monty Montgomery puts the correction plainly: “Sampled signals are often depicted as a rough stairstep (red) that seems a poor approximation of the original signal. However, the representation is mathematically exact and the signal recovers the exact smooth shape of the original (blue) when converted back to analog.”
A staircase is what you get if you hold each sample value until the next one arrives — which is a thing no correctly designed reconstruction does. The useful mental model is the one in this article’s opening image: the samples do not describe a shape, they constrain it. Infinitely many curves pass through any set of sample points, but exactly one of them contains no frequency above half the sample rate, and that one is the answer. The band limit is not a restriction on accuracy; it is the thing that makes the answer unique.
What a sample rate tells you, and what it does not
The one fact a sample rate gives you directly is its Nyquist frequency — half the rate, and the highest frequency the file can represent.
| Sample rate | Nyquist frequency | Where it comes from | What the number does not tell you |
|---|---|---|---|
| 44.1 kHz | 22.05 kHz | The compact disc, via digital audio stored on video tape | Anything about the recording, the mastering or the converter |
| 48 kHz | 24 kHz | Professional and broadcast origination; AES5’s preferred rate | Whether the extra 1.95 kHz of bandwidth contains anything |
| 88.2 kHz | 44.1 kHz | Production, as an integer multiple of 44.1 for easy conversion | Whether the release was ever recorded above 44.1 |
| 96 kHz | 48 kHz | Production, and the most common rate on hi-res download stores | Whether any of the ultrasonic band is signal rather than noise |
| 192 kHz | 96 kHz | Production and archival capture | Whether the playback equipment handles ultrasonics gracefully |
The right-hand column is the part usually missing. A sample rate is a statement about bandwidth, and bandwidth is one of the less interesting things that varies between releases. The microphone, the room, the performance, the mix and the mastering all move the result far more, and none of them is visible in the number.
There is also a cost, and it is the only thing about a high rate that is guaranteed. 24-bit 96 kHz stereo is 4,608 kbit/s of PCM against 1,411.2 for CD-standard — a little over three times the storage, before any compression. What bitrate means has the arithmetic for every common configuration, and the formats a collection actually contains covers which of them carry these two numbers at all.
Why 44.1 and 48 kHz both exist
Neither is the audiophile choice and neither was picked by listening. They come from two industries that had different problems.
44.1 kHz is an inheritance from video tape. Before dedicated digital audio recorders were affordable, studios moved PCM audio by encoding it as a video signal and recording it on a video tape machine — three samples per active line. The arithmetic lands on the same figure for both television systems then in use: 294 active lines × 50 fields per second × 3 samples = 44,100 for PAL, and 245 × 60 × 3 = 44,100 for monochrome NTSC. Colour NTSC runs at about 59.94 fields per second rather than 60, which gives 44,056 — the discrepancy that makes the story worth telling accurately rather than as a neat coincidence. The compact disc specification adopted 44.1 kHz, and consumer music inherited it.
48 kHz came from professional practice, and is the rate that AES5 — the AES recommended practice for preferred sampling frequencies — names first for professional origination, processing and interchange. It divides cleanly against video frame rates, which is why film and television audio live there.
So a 44.1 kHz file and a 48 kHz file are two industries’ historical accidents, not two quality tiers. The 2.65 kHz of extra Nyquist bandwidth in the second one is above the top of documented human hearing in both cases.
Bit depth is a noise floor, with arithmetic
Quantisation is the second half of conversion: each measurement has to be written as one of a finite set of numbers. Bit depth is how many numbers are available — 2^16 = 65,536 levels at 16-bit, 2^24 = 16,777,216 at 24-bit.
The tempting conclusion is that more levels means more detail. The correct one is that more levels means smaller error, and the error is what you actually care about, because it behaves as noise.
Here is the standard derivation, rather than the number it produces. For an ideal converter with a full-scale range FS and N bits:
quantisation step            q  = FS / 2^N
RMS of the quantisation error   = q / √12
RMS of a full-scale sine wave   = (2^N · q / 2) / √2  =  2^N · q / (2√2)

               2^N · q / (2√2)              √12
SNR = 20·log₁₀ ─────────────── = 20·log₁₀ 2^N · ───
                   q / √12                      2√2

    = 20·log₁₀(2) · N  +  20·log₁₀(1.2247)
    = 6.02·N + 1.76  dB
The √12 is the standard deviation of an error distributed uniformly across one
quantisation step, whose variance is q²/12; the 2√2 is the RMS of a sine wave
at full scale. Both coefficients fall out of those two facts, and neither is a
convention:
| Bit depth | Levels | Theoretical SNR | Where that figure applies |
|---|---|---|---|
| 8-bit | 256 | 49.9 dB | Audibly noisy on any real music |
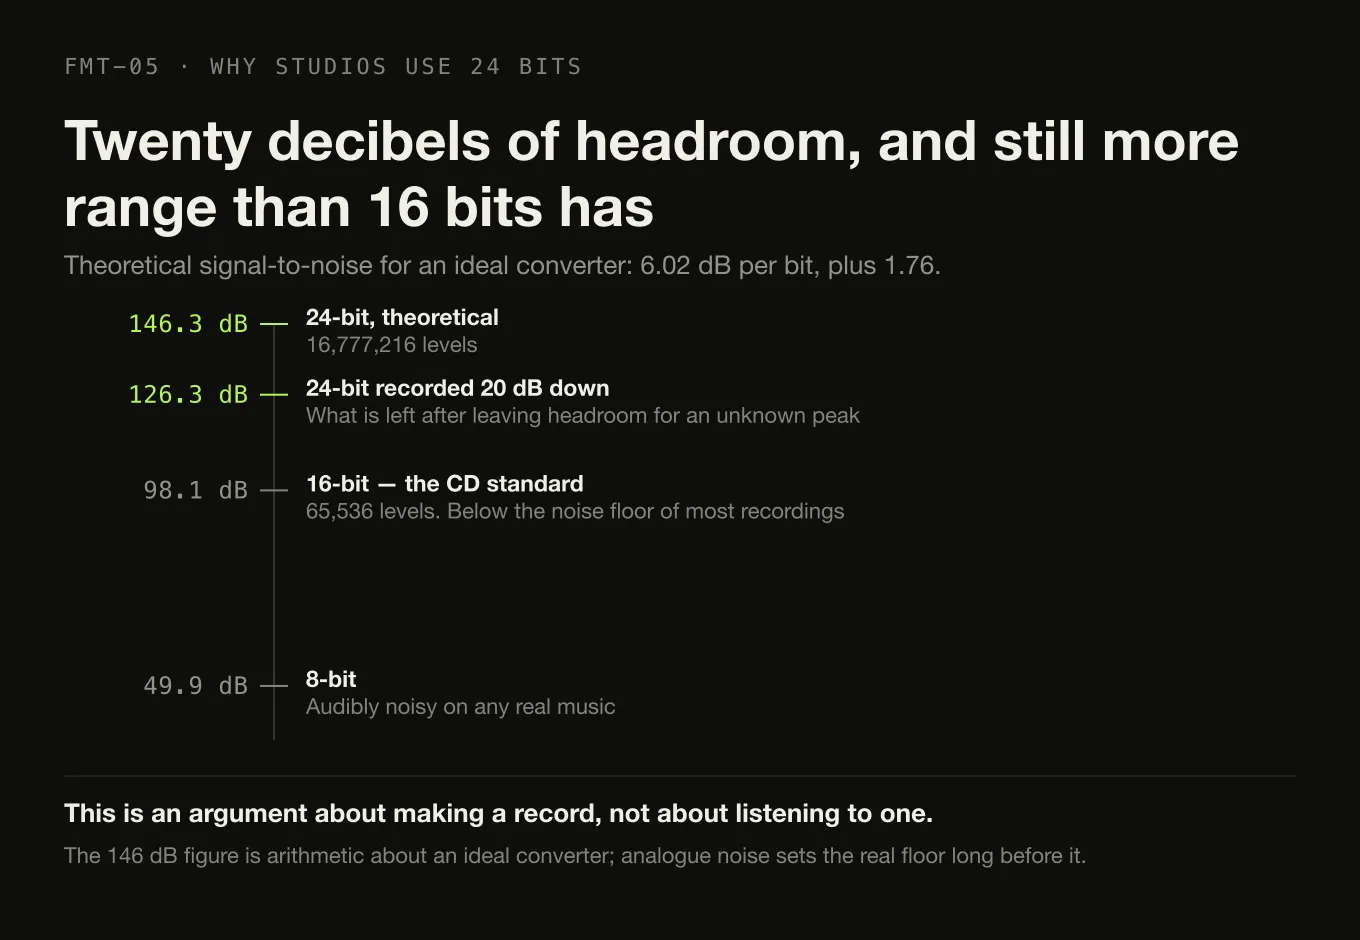
| 16-bit | 65,536 | 98.1 dB | The CD standard; below the noise floor of most recordings |
| 20-bit | 1,048,576 | 122.2 dB | Not a consumer file format; a marker between the two that are |
| 24-bit | 16,777,216 | 146.3 dB | Theoretical: analogue noise sets the real floor long before this |
That last row is the one to sit with. The 146 dB figure is arithmetic about an ideal converter, not a specification any real one meets — the analogue noise of the electronics sets the achievable floor, and it arrives long before the quantisation arithmetic runs out. A 24-bit file’s real advantage is therefore not its theoretical floor; it is that the floor is far enough away to stop being a consideration, which is a different and much more useful property.
Why dither means the floor is a floor
Left alone, quantisation error is correlated with the signal, which makes it distortion rather than noise — and correlated error is far more noticeable than uncorrelated error at the same level. Dither is a small amount of deliberately added noise that decorrelates it, converting distortion into a steady hiss.
What dither does to the error
-
No dither
Error tracks the signal
Distortion
Rounding each sample to the nearest level produces an error that is a function of the signal, so it rises and falls with the music and lands on harmonically related frequencies. Correlated error is far easier to notice than uncorrelated error at the same level, which is why this is the worst option rather than the purest one.
-
Flat dither
Error becomes noise
Steady hiss, same total power
Adding a small amount of noise before quantising decorrelates the error from the signal. The measured noise power does not fall — it may rise slightly — and yet the result is less audible, because a constant hiss is easier to ignore than distortion that follows the melody. It also allows detail below one quantisation step to survive.
-
Shaped dither
Noise moved, not removed
Same power, redistributed by frequency
The same noise is weighted towards frequencies where hearing is least sensitive, which lowers it where you listen and raises it where you do not. This is the mechanism behind the claim that 16-bit audio has more usable range in practice than the flat arithmetic suggests.
The counter-intuitive consequence is that dither lets a system represent signals below one quantisation step, and that shaping the dither noise into frequencies where hearing is least sensitive buys further usable range. Xiph.Org’s account of this puts the effective dynamic range of 16-bit audio at around 120 dB in practice with shaped dither, against the 98 dB the arithmetic above gives — a figure worth attributing rather than asserting, because it depends on the shaping used and on a specific model of hearing.
The practical upshot: the 16-bit noise floor of a well-made release sits below the noise floor of the recording that was made, the room it is played in, and the electronics playing it. That is what “enough” looks like.
Two numbers, two independent jobs
Sets The bandwidth. Everything below half the rate is represented completely; nothing above it is represented at all.
Does not set Accuracy, smoothness or detail within the band. A band-limited signal is reconstructed exactly at any rate that covers it.
Costs Storage, linearly. Doubling the rate doubles the PCM data rate.
Sets The noise floor, and so the dynamic range. About 6.02 dB per bit, derived above.
Does not set The detail in loud passages, or the shape of the waveform. It moves the floor, not the ceiling.
Costs Storage, linearly. 24-bit is 1.5× the data of 16-bit at the same rate.
Silent about The microphones, the room, the performance, the mix, the mastering, the dynamic range actually used, and whether the file was upsampled from something smaller.
Why studios use 24-bit, and why that is not a listening argument
The case for 24 bits during production is strong, specific, and about workflow rather than about ears.
Headroom. A recording engineer has to set levels before knowing how loud the performance will get. With a 24-bit converter you can leave 20 dB of headroom and still have more usable range than 16 bits offers in total, so nothing needs to be ridden and nothing clips. In 16 bits, recording 20 dB down throws away more than three bits of range you might later want.
Accumulation. Every gain change, filter and summing operation introduces rounding error. One is negligible; a hundred, on forty tracks, is not automatically negligible. Working at 24 bits — or in 32-bit floating point, which is what most software actually mixes in — keeps the accumulated noise so far below the signal that it never becomes a decision.
Both of those are arguments about the process that makes a record. Neither of them is an argument that a 24-bit copy of a finished master is audibly different from a well-made 16-bit copy of the same master, and the two claims get conflated so routinely that the distinction is worth stating flatly. Whether the larger file is worth paying for is a separate question, with its own evidence and its own answer, and this article deliberately does not attempt it — the numbers are what is being explained here.
Resampling, without the folklore
Sample-rate conversion is arithmetic: reconstruct the band-limited signal implied by the input samples, then measure it at the new rate. The error is measurable, and in competent implementations it sits far below the noise floor of any recording.
That makes most of what is said about resampling overstated in both directions. It is not free — a bad resampler is a real defect, and they exist. It is also not inherently damaging, and describing every conversion as a loss is not supported by measurement. The genuine arguments for keeping a chain at one rate are about not doing work twice, about integer ratios being cheaper than fractional ones, and about knowing what happened — which is the useful motivation, and a different one from fear.
There is a real reason to be wary of very high rates at playback, and it is not about the audio band at all. Content well above hearing can interact with non-linearity in amplifiers and transducers; as Xiph.Org describes it, “any nonlinearity will shift some of the ultrasonic content down into the audible range as an uncontrolled spray of intermodulation distortion products covering the entire audible spectrum”. That is a property of the playback equipment rather than of the file, which is exactly why it is rarely mentioned by anybody selling the file.
What any of this means at playback
For a file already on your disk, sample rate and bit depth are facts rather than choices. The questions that remain are what the chain between the file and the speaker does with them, and whether you can find out.
What actually happens between a file and your speakers walks that path stage by stage. The short version is that a decode, a possible sample-rate conversion, any DSP, and a hand-off to hardware all sit between the two, and most software tells you nothing about any of it.
Digr’s own position is worth stating precisely, because it is narrower than the topic invites. Digr does not display sample rate, bit depth or a resample path today. Local playback hands the file to the macOS media stack, so what the system does about rate conversion for the current output device is the system’s decision — and Digr neither makes it nor reports it. The per-track container is visible in the interface; a signal path is not.
The work that would show these properties, and where in the path they changed, is called Signal Chain, and it is a planned Digr Pro feature with no date against it rather than something in the application. Automatic sample-rate switching sits on the same horizon. Exclusive-mode and bit-perfect output are listed further out still, as research. The stated intention is that Digr will report the signal path it can actually verify and will not print a lossless badge over a chain whose final stage it cannot see — which is the right commitment, and is also a reason this article stops at explaining the numbers.
Sources
- Claude E. Shannon, Communication in the Presence of Noise, Proceedings of the IRE, vol. 37 no. 1, January 1949 — Theorem 1: “If a function f(t) contains no frequencies higher than W cycles per second, it is completely determined by giving its ordinates at a series of points spaced 1/2W seconds apart”, and the attribution of the 1/2W interval to Nyquist
- AES5-2018 (r2023) — AES recommended practice for professional digital audio: preferred sampling frequencies for applications employing pulse-code modulation — 48 kHz named as the preferred rate for professional origination, processing and interchange, with 44.1 kHz recognised for consumer music and 96 kHz for wider-bandwidth work
- MT-001: Taking the Mystery out of the Infamous Formula, “SNR = 6.02N + 1.76dB”, Walt Kester, Analog Devices — the standard derivation reproduced above: quantisation error RMS of q/√12, full-scale sine RMS of 2^N·q/(2√2), and the resulting SNR for an ideal N-bit converter
- 24/192 Music Downloads are Very Silly Indeed — Monty Montgomery, Xiph.Org — the stairstep depiction being misleading while “the representation is mathematically exact and the signal recovers the exact smooth shape of the original”; the effective dynamic range of 16-bit audio reaching “120dB in practice” with shaped dither; and ultrasonic content producing “an uncontrolled spray of intermodulation distortion products” through non-linearity
- RFC 9639 — Free Lossless Audio Codec (FLAC) — §1: FLAC codes for PCM “with 1 to 8 channels, sample rates from 1 to 1048575 hertz, and bit depths from 4 to 32 bits”, establishing that these are independent parameters of the stream
- John Watkinson, The Art of Digital Audio, revised reprint, Focal Press, 1989, §2.6 and §8.5 — the derivation of 44,100 samples per second from PCM adaptors storing three samples per active video line, for both 294-line/50-field and 245-line/60-field systems
Common questions
What is sample rate in audio?
The number of times per second the amplitude of a signal is measured, expressed in hertz. A 44.1 kHz file holds 44,100 measurements per second per channel. What the rate determines is bandwidth: the sampling theorem guarantees that a signal containing no frequencies above half the sample rate is completely determined by those measurements, so 44.1 kHz covers everything below 22.05 kHz and nothing above it.
What does bit depth actually change?
The noise floor, and therefore the dynamic range between the quietest representable detail and full scale. Each bit adds about 6.02 dB: an ideal 16-bit converter reaches roughly 98 dB of signal-to-noise ratio for a full-scale sine wave, and an ideal 24-bit one about 146 dB. It does not add detail to the loud parts of the signal, and it does not make the waveform smoother — it lowers the floor underneath it.
Does digital audio really look like a staircase?
No. The staircase is an artefact of how sampling is usually drawn, not of what a converter produces. Reconstruction from samples passes them through a filter that removes everything above half the sample rate, and for a band-limited signal the result is the original smooth waveform — mathematically exact, not an approximation. Any drawing that joins samples with flat horizontal steps is showing a signal that has not been reconstructed yet.
Why does 44.1 kHz exist instead of a round number?
It was inherited from the way digital audio was moved around before the compact disc existed. Studios stored PCM audio as a video signal on tape, three samples per active line, and the arithmetic landed on 44,100 for both television standards in use: 294 lines × 50 fields × 3 for PAL, and 245 × 60 × 3 for monochrome NTSC. The CD specification adopted it, and consumer music has carried it ever since.
Is 24-bit better than 16-bit for listening?
For a finished release, the case is much weaker than the numbers suggest, because a 16-bit noise floor with shaped dither already sits below the noise floor of the recording itself and of most listening rooms. Where 24 bits genuinely helps is during recording and mixing: headroom, so levels need not be ridden to avoid clipping, and room for the rounding error of many successive processing stages to accumulate harmlessly.
Does converting between sample rates damage the audio?
Not audibly, with a competent resampler. Sample-rate conversion is arithmetic with measurable error, and good implementations put that error far below the noise floor of the recording. The practical arguments for and against particular rates are about workflow, integer ratios and file size rather than about audible damage, and treating any conversion as inherently harmful is not supported by measurement.
- sample rate
- bit depth
- Nyquist
- quantisation
- dither
- dynamic range
- PCM